BindLine lets you visualize and compare protein–DNA binding levels directly along any DNA sequence using PBM data.
BindLine is an interactive web tool for exploring protein–DNA interactions using Protein Binding Microarray (PBM) data.
PBM experiments measure the relative binding strength of all possible DNA k-mers (sequences of length "k"), allowing binding preferences to be examined along full DNA sequences rather than summarized as a single consensus motif.
BindLine visualizes these quantitative scores directly on any DNA sequence,
enabling identification of binding sites even when binding is weak, degenerate, or distributed across multiple sequence contexts.
BindLine is an interactive tool, allowing users smooth exploration of the data through zooming, panning, and toggling visibility of sequences and proteins.
BindLine operates on protein PBM results and DNA sequences.
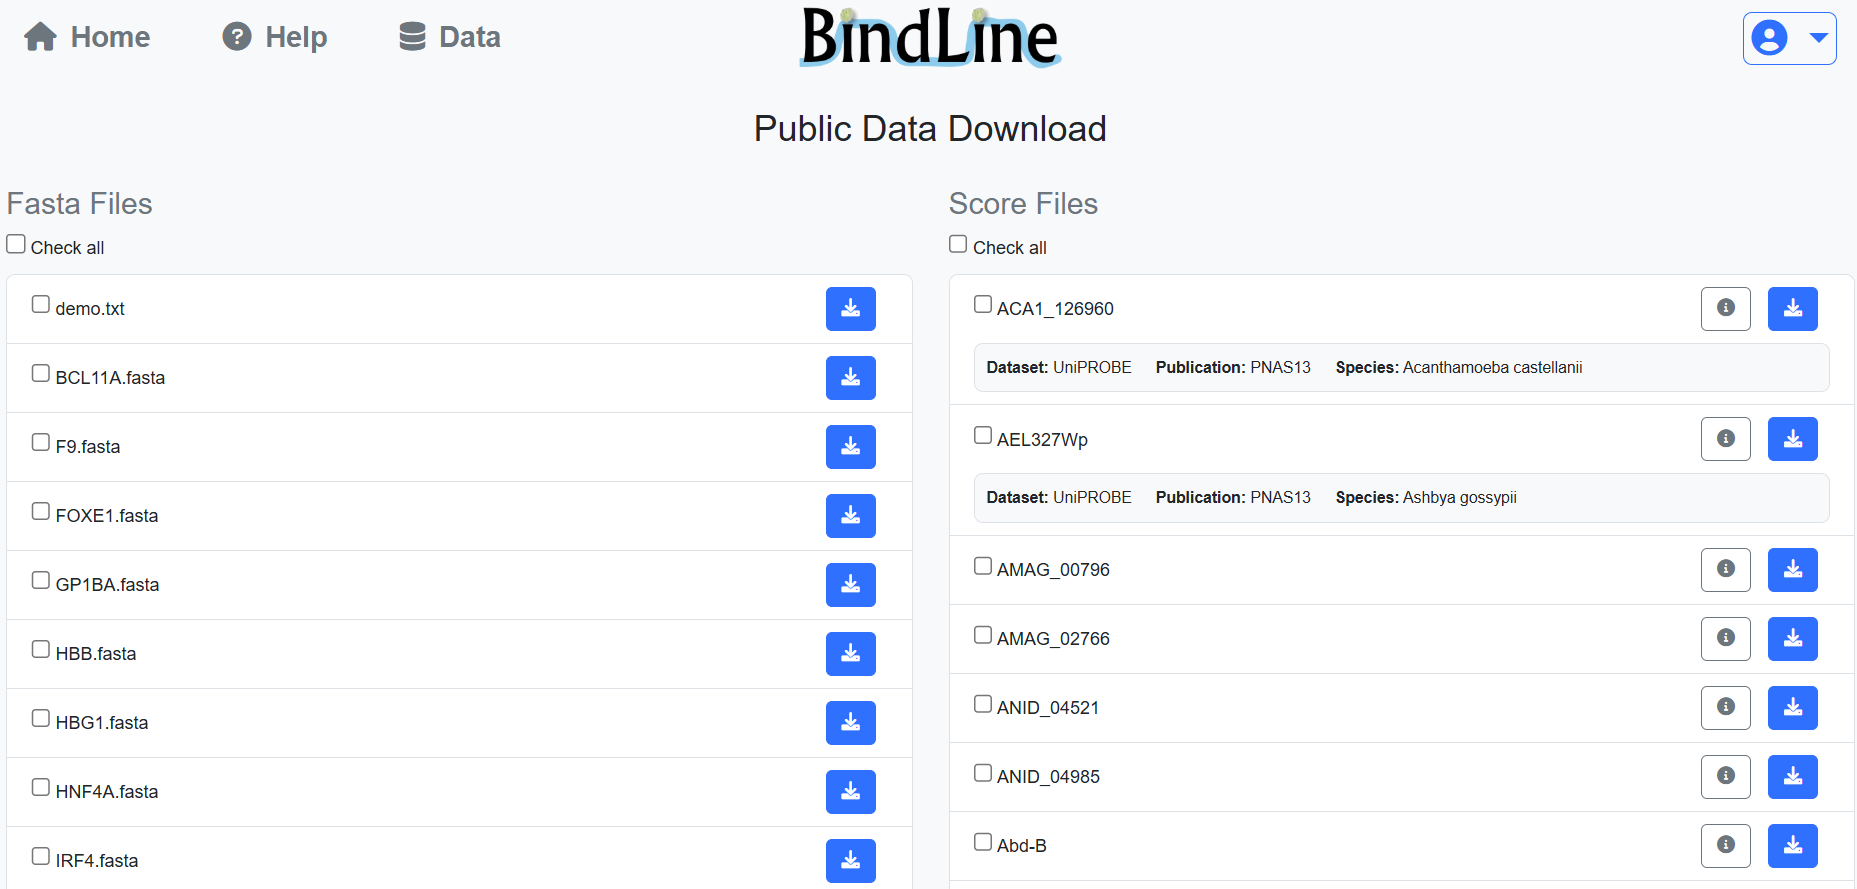
You may choose from public PBM datasets or upload your own.
As a logged-in user, you may upload files for continuous use.
Some of the public results, and possibly yours, have only part of the score types (see below).
Protein may be associated with to one or more families (PFAMs), which are used for grouping in plots.
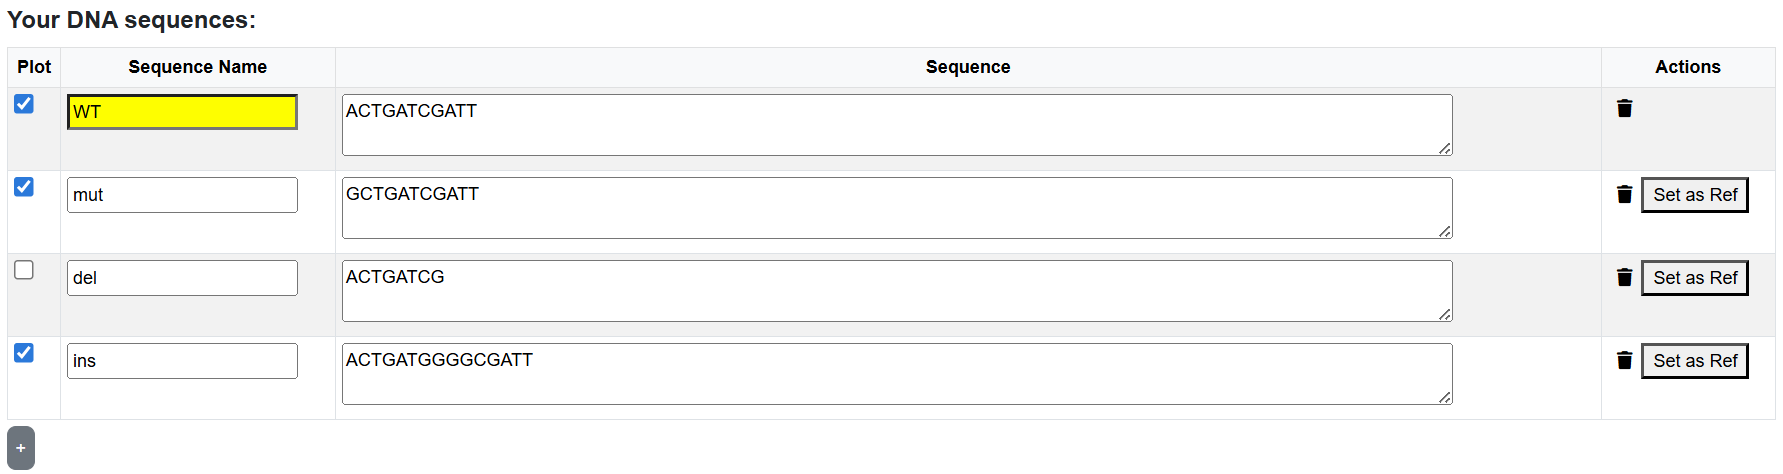
DNA sequences can be loaded from FASTA files or entered directly in the sequence table.
All sequences in a single analysis must be aligned.
The first sequence is treated as the reference sequence,
while the others are interpreted as substitutions, insertions, or deletions relative to it.
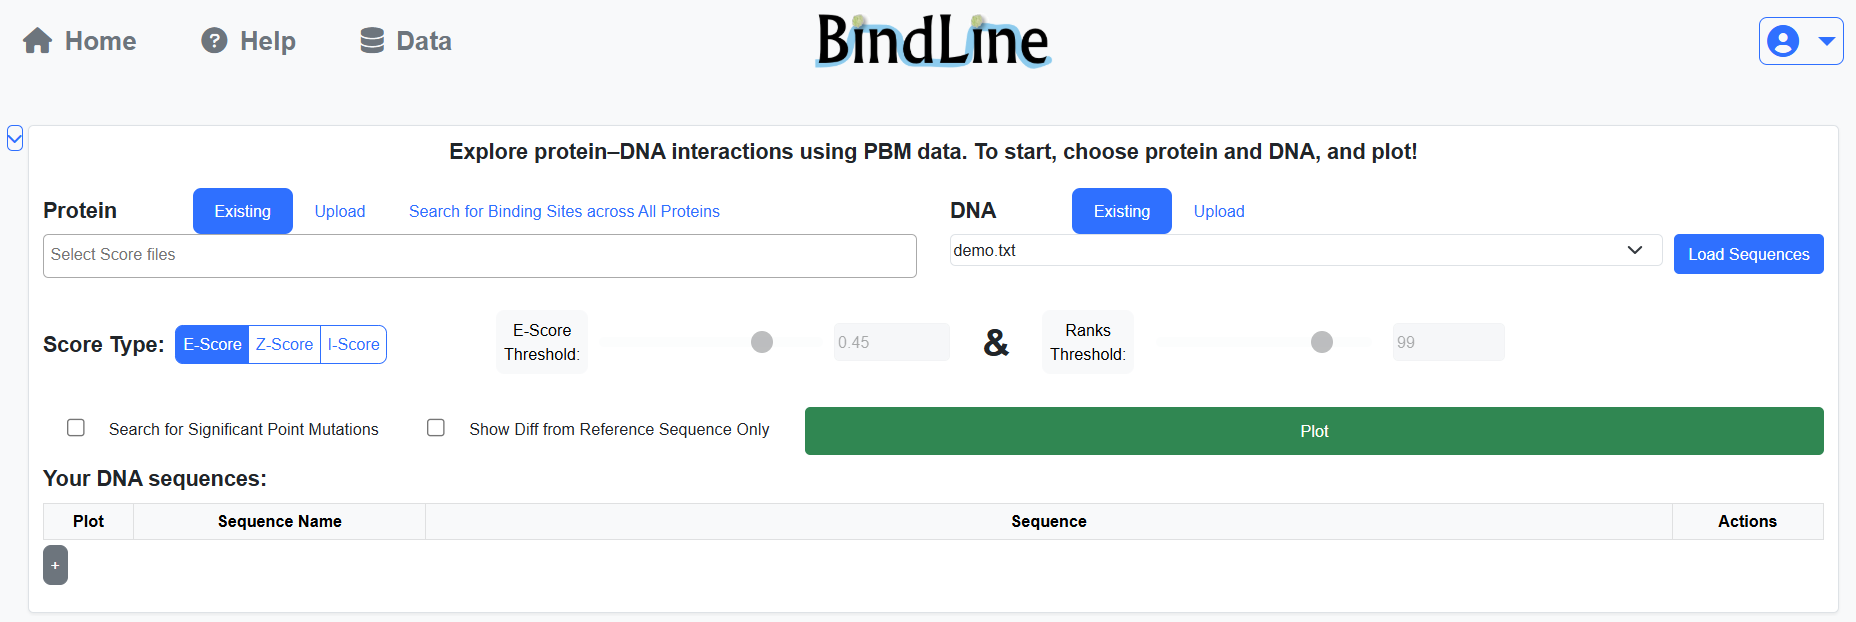
The “Load Sequences” button allows reviewing or preparing sequences before plotting.
BindLine supports three types of PBM scores to evaluate protein–DNA binding:
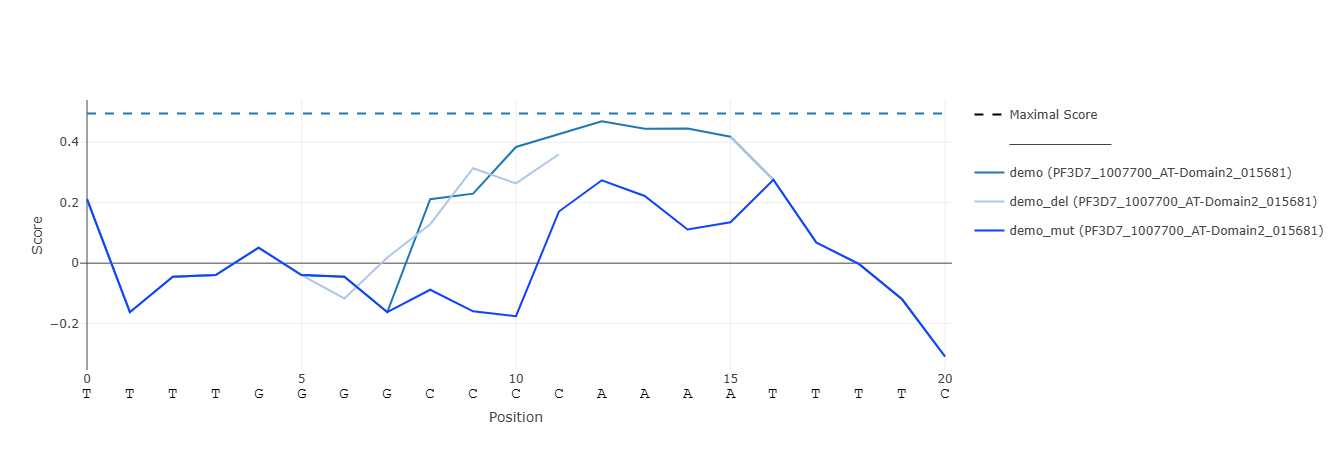
Score types that are not included in from the uploaded PBM results are unsupported. You can choose the desired type before analysis. The "BindLine" plot displays the selected score along the aligned sequences. Each point corresponds to the score of the k-mer starting at that nucleotide position.
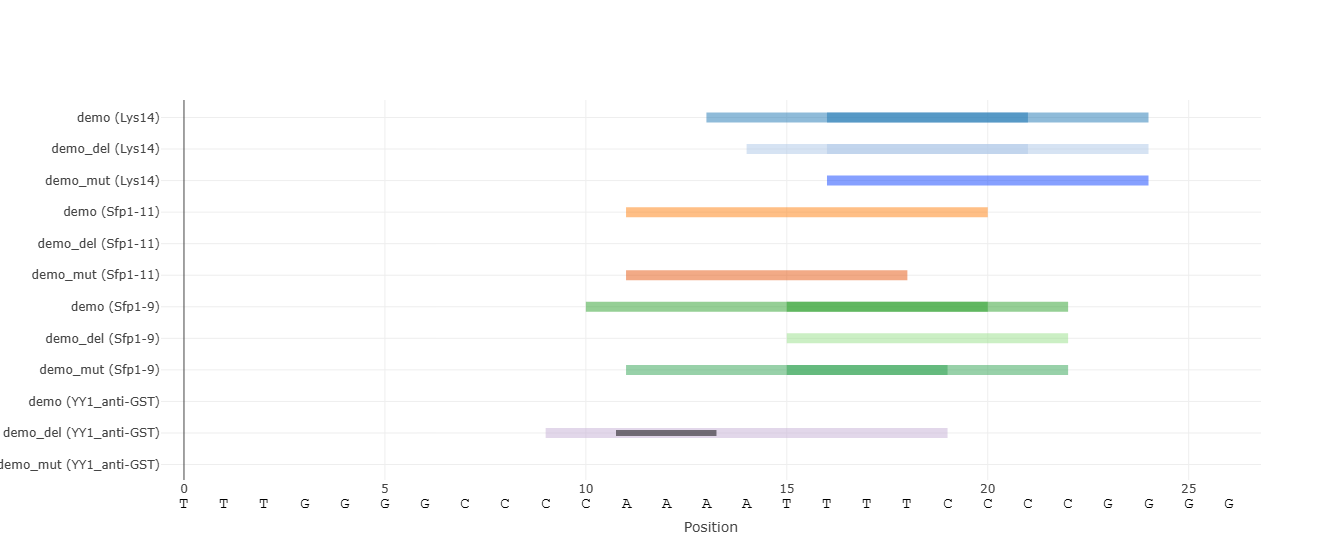
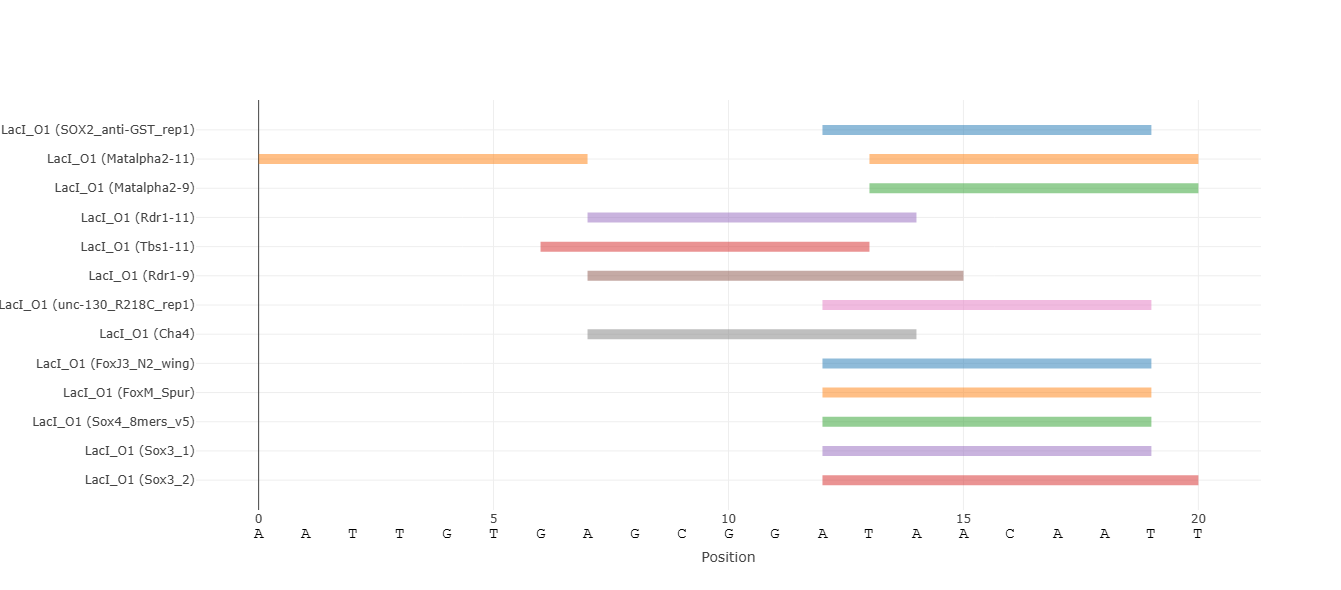
BindLine offers the application of thresholds for each score type, enabling identification of significant binding events. You may enable and adjust them with sliders or numeric input fields. Ranks threshold, which highlights only the top-scoring k-mers, is also available. When thresholds are enabled, the "Binding Sites" plot appears and visualizes overlapping, competing, or nearby binding events.
Scan all available protein datasets and display only those with at least one k-mer exceeding the selected threshold in the input sequences. This mode is useful when the relevant transcription factor is unknown. We recommend not using a low threshold, as the results will be noisy.
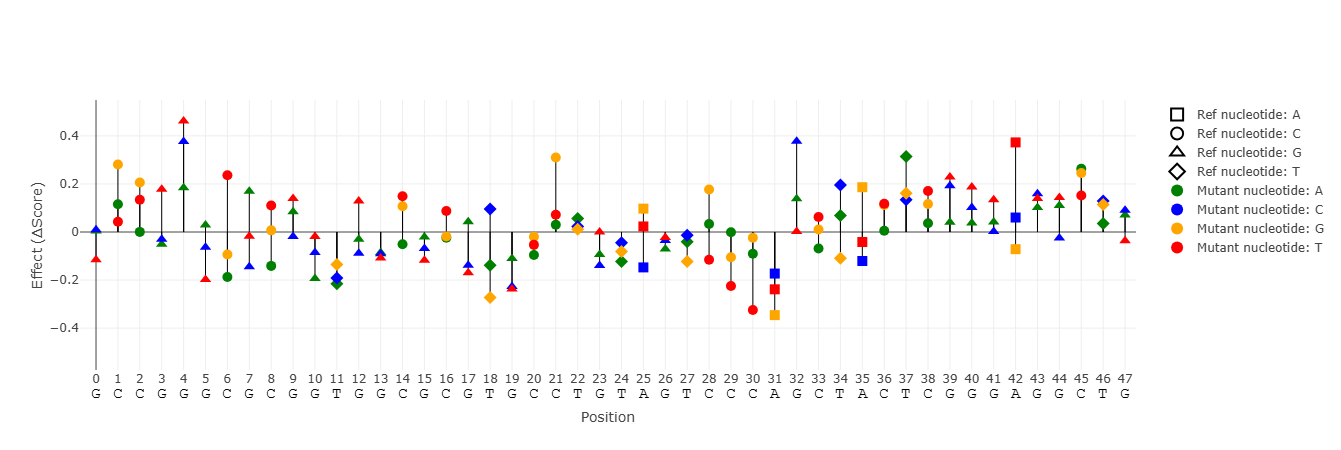
Analyze the effects of single-nucleotide substitutions, insertions, and deletions derived from a reference sequence. Only mutations that create binding sites based on the selected threshold are shown. Mutations that produce identical binding behavior are collapsed and shown only once. When using this option, the "All Mutants" plot appears. It summarizes the effect of each substitution mutation on binding scores.
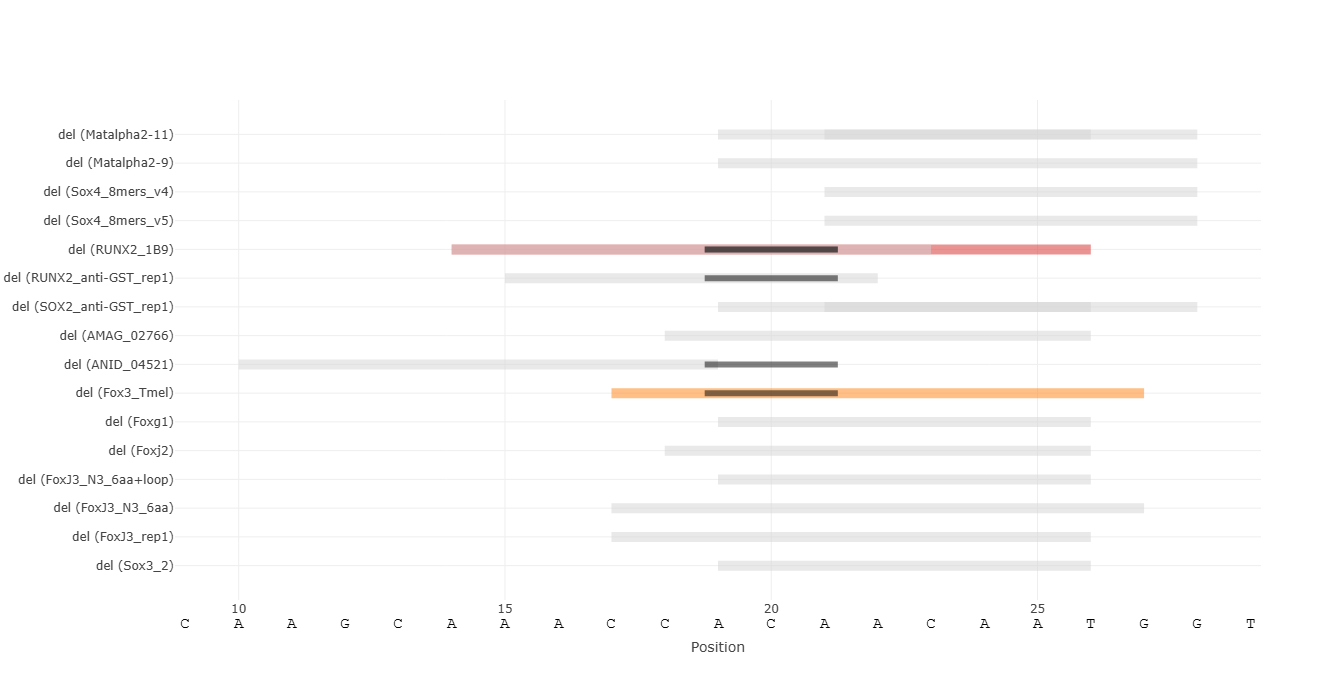
Restrict visualization to mutations that create or abolish binding sites. De-Novo binding sites are shown in color, while destroyed sites are shown in gray.
Continuous visualization of PBM scores along aligned DNA sequences. Hovering the mouse over points highlights the corresponding k-mer. Clicking a legend entry toggles visibility of that sequence. Double-clicking a legend entry isolates that sequence. If more than one sequence / protein are shown, additional legend entries appear to control groups of lines of the same sequence / protein. Maximal score for each protein is indicated by a dashed line. Zooming by click-and-drag or by control buttons changes the x-axis range in all plots simultaneously.
Discrete visualization of binding events enabled by score thresholds. Each binding site is represented as a rectangle spanning the sequence from the first to last nucleotide of the k-mers above the selected threshold. There may be overlapping binding sites for the same protein. By default, if there are multiple protein families (PFAMs) that the examined proteins belong to, grouping of their binding sites is performed to reduce visual clutter. By clicking a binding site rectangle, the traces of its PFAM are grouped / ungrouped. A toggle button allows switching between these views for all binding sites.
Summary of the effects of individual point mutations on binding scores. Each bar represents a single-nucleotide substitution relative to the reference sequence. The value indicates the difference between the highest score in the k-mer range of the mutant and the reference. A toggle button allows switching between the absolute value (score) and the effect of the mutation (difference = Δscore). It is important to pay attention to the absolute score values, and not to the mutation effect only. For that, it is recommended to look only at sites of interest in this plot.
Public PBM score files and FASTA sequences can be downloaded from the Data page. Logged-in users can manage uploaded files through their personal dashboard, including downloading or deleting files at any time.